- Teacher: SACS Computers
- Teacher: Shadrach Vanger

You will learn about various data management techniques from this course and the skills and expertise necessary to manage your data efficiently. It helps you share your data safely, and efficiently, and comply with FAIR principles. It also provides techniques for handling and organizing research data.
- Teacher: SACS Computers

The R programming language is a widely used language for conducting data analysis. You will study the basics of R in this course. Prior knowledge of coding is not required. This course will cover handling various data types, producing attractive and informative visualisations, computing various statistics on our data, and delving into the meaning of these statistical concepts. At the end, you will be able to write basic computer programmes to analyse data.
- Teacher: SACS Computers
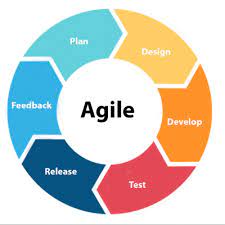
Business analysis methods are applied in an agile setting through the usage of agile business analysis approaches. You will gain the skills necessary to work on productive agile projects by taking these training courses on Agile Business Analysis, which will demonstrate how to apply Agile within the framework of Business Analysis.
- Teacher: SACS Computers
Additionally, Subject Matter Experts (SME), Business Process Managers, and Business Process Users or anyone else involved in gathering, articulating, evaluating, or comprehending requirements for information technology solutions will find this course helpful.
- Teacher: SACS Computers
What every student needs to know about artificial intelligence is covered in this course. Fast-evolving technology like artificial intelligence (AI) has effects and repercussions on both our personal life and society at large. In this course, students will study ideas like algorithms, machine learning, and neural networks as a fundamental introduction to the elements and components of artificial intelligence. Students will also examine current applications of AI and assess its shortcomings, including bias. The course also takes a fair look at how AI may affect current employment opportunities as well as its ability to pave the way for brand-new, fascinating career fields in the future. Students will comprehend what AI is, how it functions, potential danger zones, and practical applications of the technology.
- Teacher: Stephen Akuma
- Teacher: SACS Computers
You will quickly learn all the necessary abilities for an SPSS data analyst, from basic data operations to more complex multivariate methods like principal component analysis, multidimensional scaling, and logistic regression. The good news is that you don't need any prior SPSS experience. That will work if you understand the most fundamental statistical principles. You will learn the following:
- Perform simple operations with data: define variables, recode variables, create dummy variables, select and weight cases, split files
- Built the most useful charts in spss: column charts, line charts, scatterplot charts, boxplot diagrams
- Perform the basic data analysis procedures: frequencies, descriptives, explore, means, crosstabs
- Test the hypothesis of normality (with numeric and graphic methods)
- Detect the outliers in a data series (with numeric and graphic methods)
- Transform variables
- Perform the main one-sample analyses: one-sample t test, binomial test, chi square for goodness of fit
- Perform the tests of association: pearson and spearman correlation, partial correlation, chi square test for association, loglinear analysis
- Execute the analyses for means comparison: t test, between-subjects anova, repeated measures anova, nonparametric tests (mann-whitney, wilcoxon, kruskal-wallis etc.)
- Perform the regression analysis (simple and multiple regression, sequential regression, logistic regression)
- Compute and interpret various tyes of reliability indicators (cronbach's alpha, cohen's kappa, kendall's w)
- Use the data reduction techniques (multidimensional scaling, principal component analysis, correspondence analysis)
- Use the main grouping techniques (cluster analysis, discriminant analysis)
- Teacher: SACS Computers
In this comprehensive course, created by SACS Computers, you will learn the whole process of data analysis. You'll be reading data from multiple sources (CSV, SQL, Excel), process the data using NumPy and Pandas, and visualize it using Matplotlib and Seaborn. In addition, we've included a thorough Jupyter Notebook course, and a quick Python reference to refresh your programming skills.
- Teacher: SACS Computers
- Teacher: mfena kaase
- Teacher: Soomiyol Msooter
- Teacher: Ephraim Nyikwagh
- Teacher: Peter Ojoh

Learn SQL, the standard programming language that is used to manage relational databases
and perform various operations on the data in them.
You'll learn how to modify database table and index structures; add, retrieve, update and delete rows of data; and retrieving subsets of information from within relational database management systems.
- Teacher: SACS Computers